In this article, we are going to see window function in SQL and its equivalent Power BI DAX function.If you want to check out SQL basic, check it out in part 1.
Specifications
Data – Loan transaction data
Environment – Postgres and Power BI
What is window function?
A window function performs an aggregate calculation across a set of table rows and returns single or multiple rows based on the function used with it.
Window by ID partition
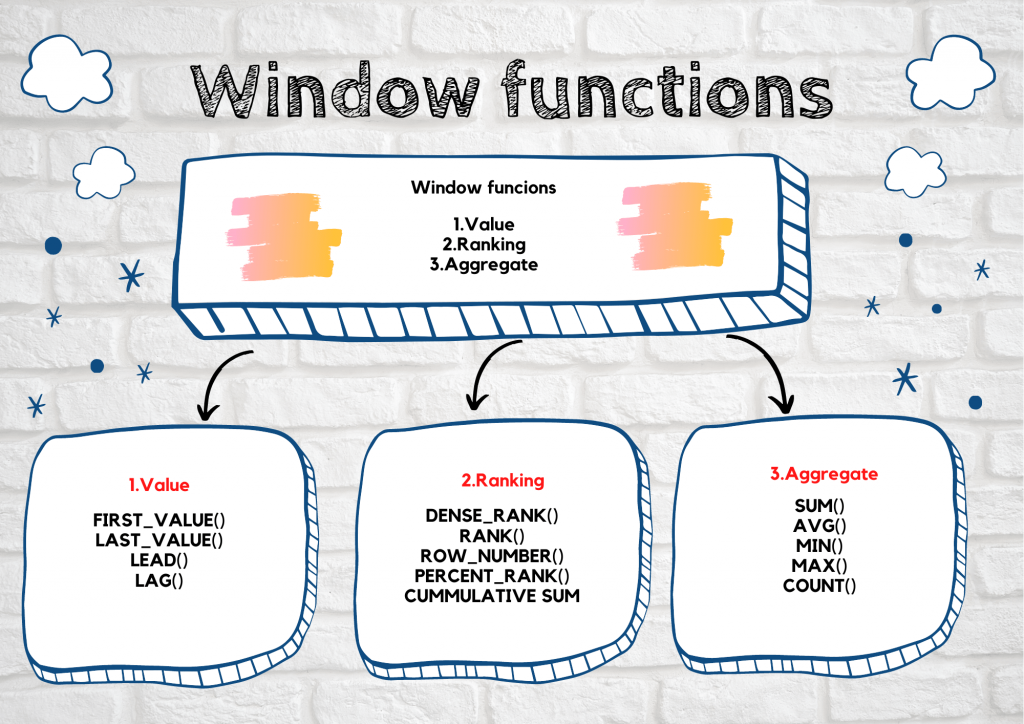
Window function classification
Window function comprises many different functions and it is grouped into 3 different categories.
Value
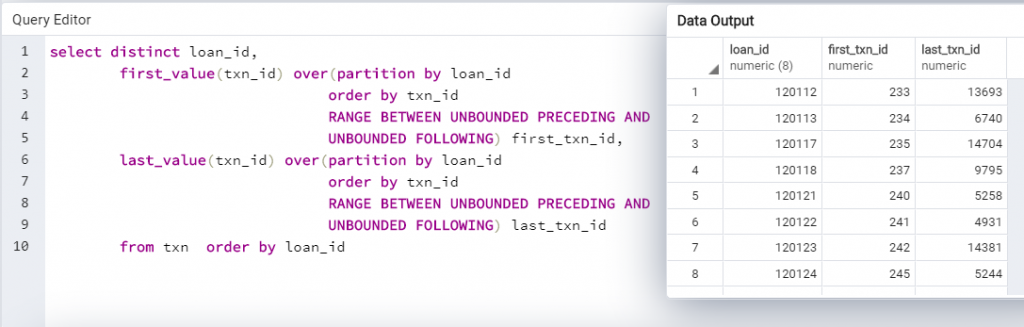
First_value
The first_value() function is a window function that returns the first value in a group or within the group.
Last_value
The last_value() function is also a window function that returns the last value in a group or within the group.
Both the functions are implemented in Power BI by using SUMX, FIRSTNONBLANK, LASTNONBLANK.
Example;
For each loan, the first and last transaction made is find by using these two functions. Its equivalent Power BI function also is given below.
First value and last value in SQL
First value and last value in Power BI
Lead
Lead is a window function that is used to fetch the next row value in the current row value itself.
Lag
Lag is also a window function that is used to retrieve the previous row value in the current row value itself.
In Power BI, it is not easy to obtain lead and lag value for any record.
But lag function can be obtained by the PREVIOUS function in Power BI where the date should be involved.click here to know more
Even lead function can be obtained by creating the index and adding 1 to index to obtain the value. click here to know more
Ranking
Rank
The Rank() function is a window function that assigns rank within the group or multiple groups. If two or more rows have the same rank it will skip the next rank.
Dense rank
The Dense_rank() function is also a window function similar to rank() function but it will not skip rank when two or more rows have the same ranks.
Both the rank functions can be implemented in Power BI DAX by using the RANKX() function with the parameter passed.
Rank and Dense rank in SQL
Rank and Dense rank in Power BI
Row number
Rownum function is used to create the row number in different ways like within a group or multiple groups.
The row number generated by using the CALCULATE function in Power BI.
Example:
In here, I explain the row number created within loan number ordering on the transaction-id
Row number in SQL
Row number in Power BI
Percentile rank
Percentile_rank() is a window function that returns the percentage of scores in its frequency distribution that is equal or lower than that.
It is calculated in Power BI by using the CALCULATE, RANKX, and DIVIDE functions.
Example:
Percentile rank within loan id based on the transaction.
Percentile rank in SQL
Percentile rank in Power BI
Cumulative sum
Cumulative sum refers to running sum and it is implemented in SQL by using sum with a window function and in Power BI implemented by using CALCULATE and SUM function.
Example:
Running sum of transaction amount within the loan id.
cumulative in SQL
Cumulative in Power BI
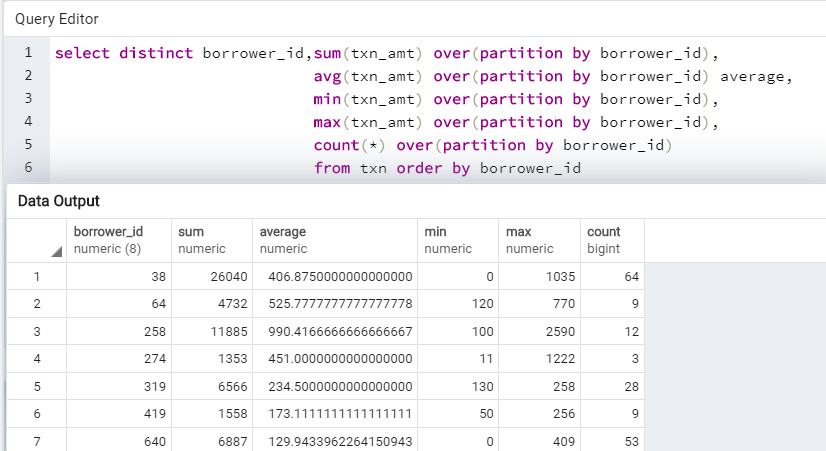
Aggregate
Windows function acts on the aggregate functions and returns the output by row-level known as window aggregate function. The same can be obtained in Power BI by using the formatting option available at the field level.
Example:
Here I explain the aggregate function on the transaction records by the customer level.
Some of the aggregate functions are:
SUM
Return the sum of the transaction amount.
AVG
Return the average value of the transaction amount
MIN
Return the minimum of the transaction amount.
MAX
Return the maximum of the transaction amount.
COUNT
Return count of records of the transaction.
Windows aggregate function in SQL
Aggregate function in Power BI
Windows aggregate function will be faster than normal group by function in SQL. So these are the some of the window function equivalent in Power BI.
Tableau Certified Data Analytics professional with 7+ years of overall IT experience and 4 years of experience in analytics. Completed Post graduate program in Data science and Engineering from Great Lakes. Having good knowledge in Tableau, PowerBI, SQL and Python. Member of Data Visualization Society(DVS). Currently working as Data Analyst in Elsevier, a publishing and information analytics company.