SQL is the most widely used language for reporting or querying any historic data. In this article, I am going to explain how to convert SQL functions to Power BI DAX.
SQL has many functions, so I explain the aggregate and non-aggregate function in part one. Some other functions are explained in my upcoming article.
Specifications
Data – Retail data
Environment – Postgres and Power BI
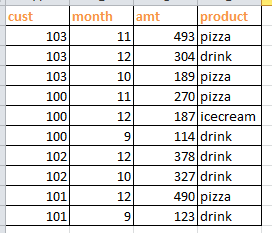
Retail data
Aggregate functions
The most commonly used aggregate functions are sum, average, minimum, maximum, count, and group by. The group by function can be combined with all other aggregate functions to have the output at level 1, level 2, etc..
Sum
The sum function is one of the most commonly used functions in SQL as well as DAX. It returns the sum of the values passed to it. The SQL as well as DAX function example below:
SQL
DAX
Avg
The average function returns the arithmetic mean of the values passed to it. The SQL as well as DAX function example below:
SQL
DAX
Min
The min function returns the minimum value of the input column. In power BI, it works on the text also by giving the value based on the alpahbets askey value. The SQL as well as DAX function example below:
SQL
DAX
Max
The max function returns the maximum value of the input column. In power BI, it also works on the text by giving the value based on the alphabets ASCII value. The SQL as well as DAX function example below:
SQL
DAX
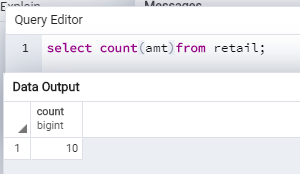
Count
It counts the number of values passed to it. It works on the text as well as numbers. The SQL as well as DAX function example below:
SQL
DAX
Group by
The group by function is used with aggregate functions to obtain the output by different categories. All of the above-mentioned functions can be combined with the product column and the output given below.
SQL
DAX
Non-aggregate functions
The non-aggregate functions are mostly used for data slicing and wrangling data. In here, we are going to see case conversion and string manipulation functions.
Case Conversion functions
It accepts the character as an input and returns the formatted character value. Mostly used case conversion functions are UPPER, LOWER, and INITCAP.
UPPER – This function converts a string to the upper case.
LOWER – This function converts a string to the lower case.
INITCAP- This function converts only the initial alphabets of a string to the upper case.
The SQL, as well as the DAX queries, are explained below.
SQL
DAX
String functions
It accepts character as an input and returns the formatted value. Some of the important functions are CONCAT, LENGTH, SUBSTR, INSTR, LPAD, RPAD, TRIM, and REPLACE.
Concatenate
SQL – This function concatenates the two or more string/numeric values.
DAX – & symbol used for concatenate. In built concatenate function, able to use only 2 values.
Length
SQL – This function returns the length of the input string.
DAX – LEN function do the same as the SQL length function.
Substr
SQL- This function returns a portion of a string from a given start point to a given endpoint.
DAX – MID function can be used as SQL equivalent of SUBSTR function.
SQL
DAX
Position
SQL – This function returns the numeric position of a character or a string in a given string.
DAX – FIND function is used to find the numeric position of a character in a string.
Lpad & Rpad
SQL – These functions pad the given string up to a specific length with a given character.
DAX – No direct function in Power BI, but it can be achieved by using LEFT, RIGHT, and REPEAT functions.
Replace
SQL – This function replaces the characters from the input string with a given character.
DAX – SUBSTITUTE function can be used for replacing a string in a character.
This covers most of the basic SQL functions used for KPI’s (Key Performance Indicator) calculation or data manipulation. If any more basic functions need to be explained post it in comments, I will try to update it.
Tableau Certified Data Analytics professional with 7+ years of overall IT experience and 4 years of experience in analytics. Completed Post graduate program in Data science and Engineering from Great Lakes. Having good knowledge in Tableau, PowerBI, SQL and Python. Member of Data Visualization Society(DVS). Currently working as Data Analyst in Elsevier, a publishing and information analytics company.